
Bank Customer Churn Analytics Dashboard (Power BI Project)

Power BI Dashboard
1. Project Overview
This project focuses on analysing customer churn patterns using a structured data model and interactive Power BI dashboards. Multiple datasets were cleaned, modelled, and integrated to uncover churn drivers, behavioural trends, and demographic insights. The final solution includes five interactive dashboard pages with drill-through, bookmarks, and advanced DAX calculations.
2. Problem Statement
Customer churn poses a major financial challenge for banks. High exit rates reduce long-term profitability and increase customer acquisition costs. Without a clear understanding of why customers leave and which segments are most at risk, decision-makers cannot design effective retention strategies.
The challenge lies in transforming fragmented data into a unified structure and enabling targeted insights through interactive analytics.
3. Objectives
-
1. Build a unified analytical model
-
Clean and transform multiple CSV/Excel files.
-
Establish relationships and construct a clean star-schema data model.
-
-
2. Analyse key factors influencing churn
-
Study patterns related to age, gender, credit score, geography, and product usage.
-
Assess churn distribution across salary bands and credit categories.
-
-
3. Create interactive dashboards
-
Provide visual insights through pie charts, bar charts, line charts, and KPIs.
-
Enable dynamic filtering with slicers.
-
Include drill-through capability for detailed customer-level exploration.
-
-
4. Implement what-if scenario modelling
-
Build parameters for salary increase, tenure increase, and credit score improvement.
-
Simulate churn reduction and calculate retention improvement %.
-
-
5. Support business decision-making
-
Highlight actionable insights to reduce churn.
-
Help segment customers for targeted retention campaigns.
-
4. Data
The dataset consists of over 10,000 customer records spread across multiple files obtained from the GitHub repository. Key files include:
-
Bank_Churn (fact table with age, credit score, balance, tenure, churn status, salary)
-
CustomerInfo (customer names)
-
ActiveCustomers (active/inactive category)
-
Credit Card (holder vs. non-holder)
-
ExitCustomer (exit/retain)
-
Gender (gender category)
-
Geography (country mapping)
Each table was cleaned and standardised using Power Query.
-
Data Cleaning & Preparation
Power Query Steps
-
Converted first rows to headers where required
-
Applied correct data types using auto-detect
-
Removed unnecessary columns such as RowNumber
-
Checked uniqueness of CustomerID
-
Removed nulls and validated data consistency
Date Table Creation
A date master table was created using DAX and following columns were added
-
Year
-
Month
-
Month Name
-
Quarter
-
Data Model

Star schema model connecting the fact table (Bank_Churn) with dimension tables such as DateMaster, Geography, Gender, CustomerInfo, Credit Card, Active Customers, and Exit Customer
This structure enables accurate DAX calculations and high-performance filtering.
10,000+ customer records across 7 related tables (fact + dimensions) modelled into a star schema. I designed the data model, relationships, and transformations end-to-end.
5. Dashboard Design
1. Overview Page
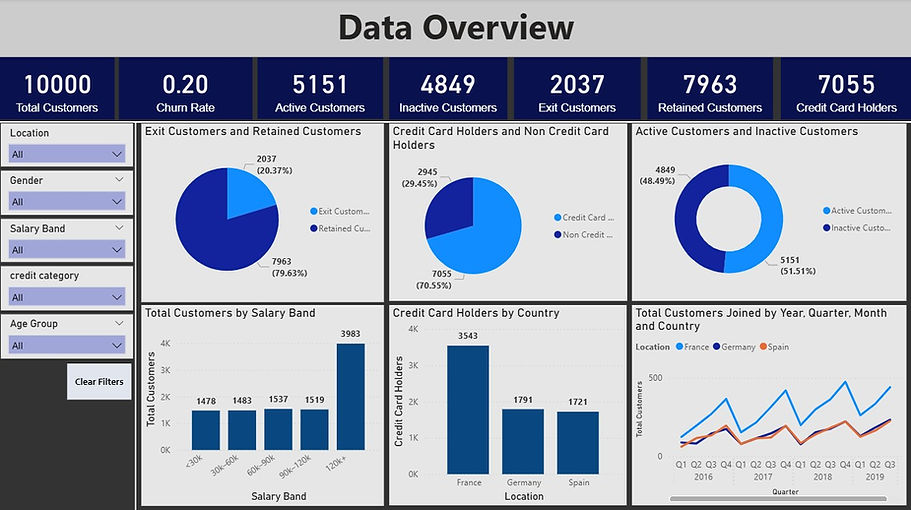
Overview Page
-
Key Highlights
-
KPI Cards using measures created: Total Customers, Churn Rate, Active Customers etc
-
Visuals including pie charts, donut charts, column charts
-
Time-series visual of customer trends with drill up drill down feature to go into quarterly, monthly and daily levels
-
Slicers for: Location, Gender, Salary Band, Credit Category, Age Group and a button to reset slicers
2. Customer Demographics Page
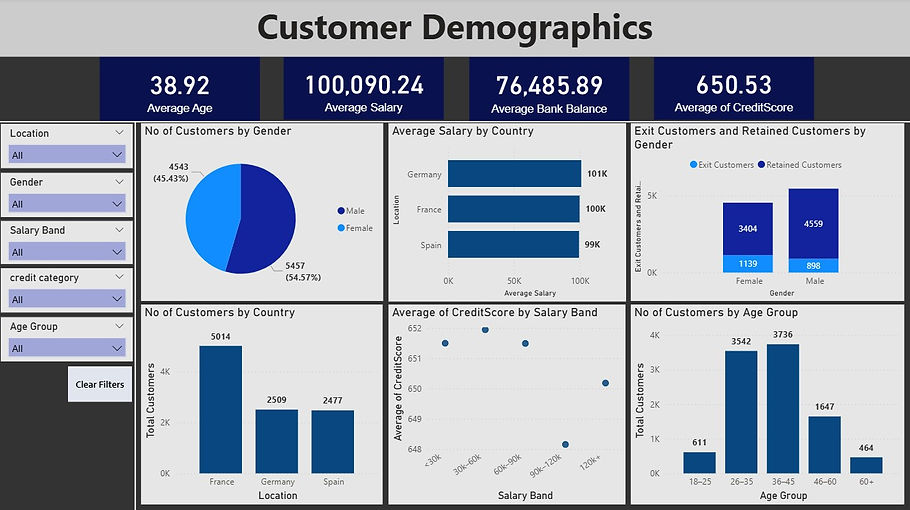
Customer Demographics
Includes:
-
Average age, average salary, average bank balance, average credit score
-
Customer distribution by age group, gender, salary band, and country
-
Credit score trends by segment
-
Exit/retained customer breakdown
3. Churn Analysis Page

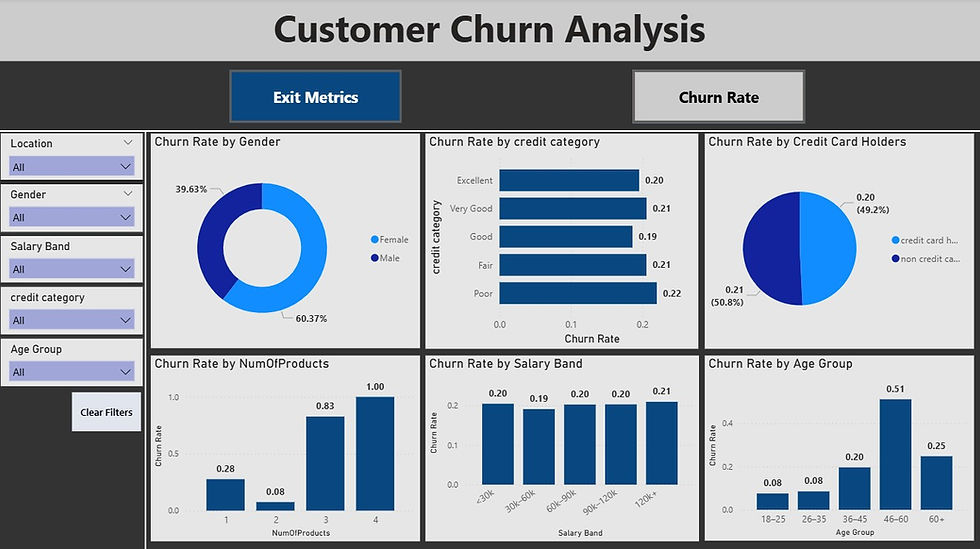
Churn Analysis
-
Special feature: Bookmarks + Toggle Buttons
Two modes:
Exit Metrics
-
Exit customers by credit category
-
Exit customers by number of products
-
Exit customers by age group
-
Exit customers by gender
Churn Rate
-
Churn rate by gender
-
Churn rate by salary band
-
Churn rate by credit category
-
Churn rate by credit card holder status
This allows users to switch between volume insights and rate insights instantly.
-
Exit Metrics show where churn volume is highest (impact).
-
Churn Rate Metrics show where churn probability is highest (risk).
Together, they identify priority areas for intervention.
4. Drill-Through Details Page

Drill-Through Details
A detailed table displaying individual customer information such as age, credit score, salary, country etc.
Users can click on any segment from other pages and drill through to see the underlying records.
5. What-If Analysis Page

What-if Analysis
Built using three parameters:
-
Tenure Increase
-
Salary Increase
-
Credit Score Improvement
Key simulated measures:
-
Simulated Churn Rate
-
Churn Reduction %
-
Retention Improvement %
Visualizations include:
-
Slicers to change parameters and see the impact
-
Simulated vs actual churn rate by salary band and credit category
-
Impact analysis scatter plot
-
Country-level simulated churn table
This page helps decision makers test different retention strategies and forecast outcomes.
For example, a simulated +1 year increase in average tenure and +10% salary uplift reduces churn from 20% to 17%, improving retention by ~3 percentage points.
6. Insights & Impact
Key Insights
-
Churn rate is approximately 20% (2,037 of 10,000 customers).
-
Customers with low credit scores or poor category show the highest churn.
-
Age group 46–60 has the highest exit rate.
-
Customers with only 1 product churn the most.
-
Salary has a slight impact, but credit score and tenure are stronger drivers.
-
Simulated improvements show meaningful potential retention increases.
This dashboard enables the bank to:
-
Identify high-churn groups (e.g., customers with low credit scores, high age groups, or low tenure)
-
Understand churn behaviour across demographics
-
Time-series visual of customer acquisition and cohort churn rate by join date with drill up/down to quarterly, monthly and daily levels.
-
Explore customer details at the most granular level
-
Simulate retention strategy outcomes
The solution provides actionable intelligence for strategic decision-making.
7. Tools Used
-
Power BI
-
Power Query
-
DAX
-
Data Modelling
-
Interactive Visualisation
8. Skills Demonstrated
-
Power BI: data modelling (star schema), advanced DAX, What-If parameters
-
Power Query: data cleaning, type detection, dimension building
-
Analytics: churn segmentation, cohort-style analysis, scenario simulation
-
UX: bookmarks, button navigation, drill-through, custom slicer panel
9. GitHub Repository