

1.Project Overview
-
Problem Statement
Freelancing platforms rely on accurate and standardized freelancer data to match clients with the right talent. However, inconsistencies in demographic, experience, and rate data reduce trust and distort analysis. This project aims to clean and standardize freelancer data and develop a dashboard to provide insights into talent distribution, pricing, and satisfaction across countries.
-
Objective
to clean messy freelancer data and build an interactive dashboard for meaningful insights.
2.Tools and Skills Used
-
Tools: Microsoft Excel (PivotTables, PivotCharts, Slicers, Conditional Formatting).
-
Skills Demonstrated: Data Cleaning, Data Wrangling, Dashboard Design, Business Analytics.
3.Dataset & Cleaning
-
Dataset
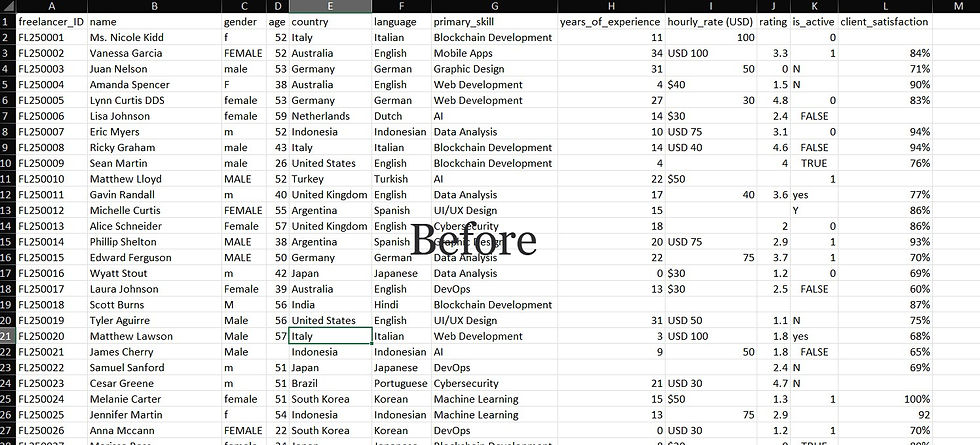
I used a dataset from "Kaggle" which consisted of fields "freelancer_ID, name, gender, age, country, language, primary_skill, years_of_experience, hourly_rate, rating, is_active, client_satisfaction. the raw dataset also contains a number of inconsistencies, such as variations in gender labels (e.g., f, Female, FEMALE, male, M), irregular formatting in hourly rate entries (e.g., $40, USD 100, 50), missing values in ratings and satisfaction, and unstandardized status indicators (e.g., 0, 1, TRUE, FALSE, Y, N). These issues highlight the need for data cleaning and standardization before meaningful analysis and visualization can be performed.
-
Cleaning
-
Removed duplicates by Freelancer ID.
-
Standardized name formats (removed titles).
-
Normalized gender values (Male/Female only).
-
Created experience buckets (0–5, 6–10, etc.).
-
Cleaned hourly rate column (removed $, USD, inconsistencies).

4.Dashboard Design
To visualize the cleaned dataset, I built an interactive Excel dashboard using PivotTables, PivotCharts, and Slicers. The pivot tables (shown below) summarize freelancer information across multiple dimensions such as skill, gender, experience, hourly rate, country, language, and activity status.
➡️ Pivot tables provided the foundation for aggregating data and calculating key metrics such as average ratings, hourly rate distribution, and freelancer counts by demographics.

Global Freelancer Pivot Tables
The final dashboard (shown below) consolidates these pivot tables into a single, interactive view. It allows users to filter freelancers by status, primary skill, and experience bucket while providing a visual breakdown of key attributes.

Global Freelancer Dashboard
The dashboard design includes the following key components:
-
Summary KPIs (Top Row): Total freelancers, average hourly rate, average years of experience, and percentage of active freelancers.
-
Demographics:
-
Percentage by Gender (pie chart)
-
Count by Language (bar chart)
-
Count by Country (bar chart)
-
-
Experience & Rates:
-
Years of Experience (bar chart by bucket)
-
Hourly Rate Distribution (percentage by rate level)
-
-
Skills & Performance:
-
Rating by Primary Skill (bar chart comparing average ratings across domains)
-
This structured layout provides a holistic view of the freelancer marketplace, enabling easy exploration of trends and relationships within the dataset. The use of slicers ensures interactivity, allowing stakeholders to focus on specific subsets of freelancers based on status, skill, or experience level.
5.Key Insights
-
Balanced gender split (49% Female vs 51% Male).
-
Average hourly rate = $53, most common rate = $40/hr.
-
Most freelancers (39%) have 0–5 years of experience.
-
English is the most common language (215 freelancers).
-
DevOps freelancers have the highest rating (2.81).
-
Only 45% of freelancers are active, showing limited supply.
6.Business Value
This dashboard helps clients benchmark freelancer rates, identify skill availability, and evaluate satisfaction trends. For platform administrators, it highlights inactive freelancers, demographic distribution, and pricing trends to improve engagement strategies.
7.Project Files