
Uber Rides Data Analysis (Python Project)

Monthly trips trend
1. Project Overview
The aim was to investigate business travel patterns and discover insights that can help:
-
Uber improve operational planning and resource allocation
-
Uber drivers maximize earnings by focusing on high-demand areas and times
-
Corporate customers optimize travel costs and scheduling efficiency
By analyzing trip timestamps, miles travelled, locations, and ride purpose, the study reveals clear business-driven mobility trends and opportunities for data-driven decision-making.
2. Tools & Skills Used
-
Python (Jupyter Notebook – VS Code)
-
Pandas, NumPy
-
Matplotlib, Seaborn
-
Data cleaning & preparation
-
Exploratory data analysis (EDA)
-
Feature engineering
3. Data Preparation $ Engineering Workflow
Before analyzing the data, several preprocessing steps were performed to ensure accuracy, remove noise, and enrich the dataset for insights.
Data Loading
-
Imported the Public Kaggle dataset (by Zeeshan-ul-hassan Usmani) into Python using Pandas
-
Performed initial checks (shape, info, head, null-value summary)
-
Scanned for inconsistencies and anomalies
Data Cleaning
Cleaning Step Result
Removed entries with missing timestamps or locations -1 row removed
Standardized column names (removed “*”) All columns cleaned
Filled 502 missing Purpose values Replaced with "Unknown"
Converted date columns to datetime format Enabled time-based feature extraction
Feature Engineering
New Feature Purpose
START_HOUR Identify peak usage hours
START_WEEKDAY Detect weekday/weekend patterns
START_MONTH Analyze seasonal trends
DURATION_MINS Compare travel distance vs. time
ROUTE (Start → Stop) Discover most common business routes
➡ These transformations enabled time-based demand analysis, routing insights, and purpose classification trends.
4. Key Findings

94% of the rides are for business purposes
Business Usage Dominates
-
93% of all trips are business-related
-
94% of total miles driven for business
→ Uber is mostly used for corporate travel in this dataset
Business purpose travel dominates
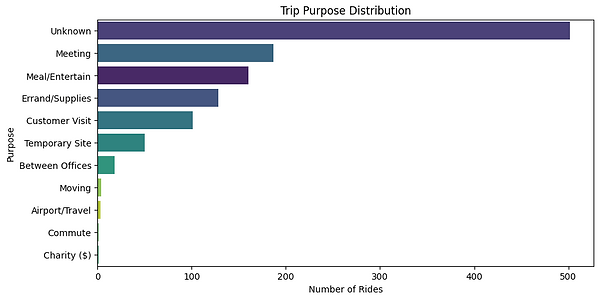
Most Business-Driven Purposes
-
Common purposes: Meetings, Meal/Entertainment, Errands
-
43% Unknown → opportunity to improve data capture

Busiest day is Friday and peak hours are from 11.00am - 2.00pm
Busiest Day & Time
-
Friday is the busiest day
-
Peak travel: 11:00 AM – 2:00 PM
-
Very low late-night usage → not leisure activity
Uber should ensure the availability of drivers for these busy routes
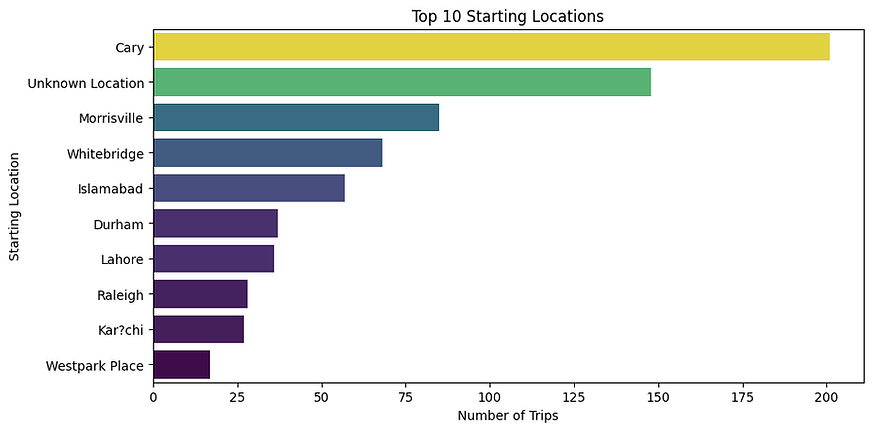
Demand by Location
-
High-demand starting areas:
-
Cary
-
Morrisville
-
Whitebridge
-
Some Unknown locations → need better standardization

Distance distribution
Typical Travel Distance
-
Most rides < 50 miles (urban commuting)
-
Some very long trips 200–300+ miles
→ Potential airport/inter-city travel cost review
Find more visuals and analysis in notebook in my GitHub:
5. Insights & Recommendations
Takeaway:
Uber demand in this dataset is strongly driven by weekday business activity, not leisure.
Aligning drivers, pricing, and travel planning to these patterns supports efficiency, revenue growth, and cost savings.
Who benefits from this analysis:
-
Uber → better resource planning
-
Drivers → increased earnings
-
Organizations & customers→ travel cost optimization
6. Project Files
This project is available on GitHub including:
-
Full Jupyter Notebook with code and visualizations
-
Data folder (with a link to download the dataset)
-
Project documentation (README)
🔗 GitHub:
https://github.com/manpb/uber-rides-analysis-python.git